ml-in-args
Correlation Analysis
Geovanny Risco May 30, 2023
1 Import libraries
library(tidyverse)
## Warning: package 'tidyverse' was built under R version 4.1.3

## -- Attaching packages --------------------------------------- tidyverse 1.3.2 --
## v ggplot2 3.4.1     v purrr   1.0.1
## v tibble  3.1.8     v dplyr   1.1.0
## v tidyr   1.3.0     v stringr 1.5.0
## v readr   2.1.4     v forcats 1.0.0

## Warning: package 'ggplot2' was built under R version 4.1.3

## Warning: package 'tibble' was built under R version 4.1.3

## Warning: package 'tidyr' was built under R version 4.1.3

## Warning: package 'readr' was built under R version 4.1.3

## Warning: package 'purrr' was built under R version 4.1.3

## Warning: package 'dplyr' was built under R version 4.1.3

## Warning: package 'stringr' was built under R version 4.1.3

## Warning: package 'forcats' was built under R version 4.1.3

## -- Conflicts ------------------------------------------ tidyverse_conflicts() --
## x dplyr::filter() masks stats::filter()
## x dplyr::lag()    masks stats::lag()
2 Read data
args_data_cleaned_path <- "data/results/resfinder/args_data_latest_cleaned.tsv"
args_data <- read_tsv(args_data_cleaned_path)
## Rows: 6208 Columns: 145
## -- Column specification --------------------------------------------------------
## Delimiter: "\t"
## chr   (1): sample_name
## dbl (144): aac(3)-IId, aac(3)-VIa, aac(6')-Iaa, aadA1, aadA2, aadE-Cc, ant(2...
##
## i Use `spec()` to retrieve the full column specification for this data.
## i Specify the column types or set `show_col_types = FALSE` to quiet this message.
amr_labels_cleaned_path <- "data/results/data_collection_ncbi/amr_labels_latest_cleaned.tsv"
amr_labels <- read_tsv(amr_labels_cleaned_path)
## Rows: 6207 Columns: 14
## -- Column specification --------------------------------------------------------
## Delimiter: "\t"
## chr  (1): SampleID
## dbl (13): amoxicillin-clavulanic acid, ampicillin, cefoxitin, ceftiofur, cef...
##
## i Use `spec()` to retrieve the full column specification for this data.
## i Specify the column types or set `show_col_types = FALSE` to quiet this message.
3 Correlation analysis
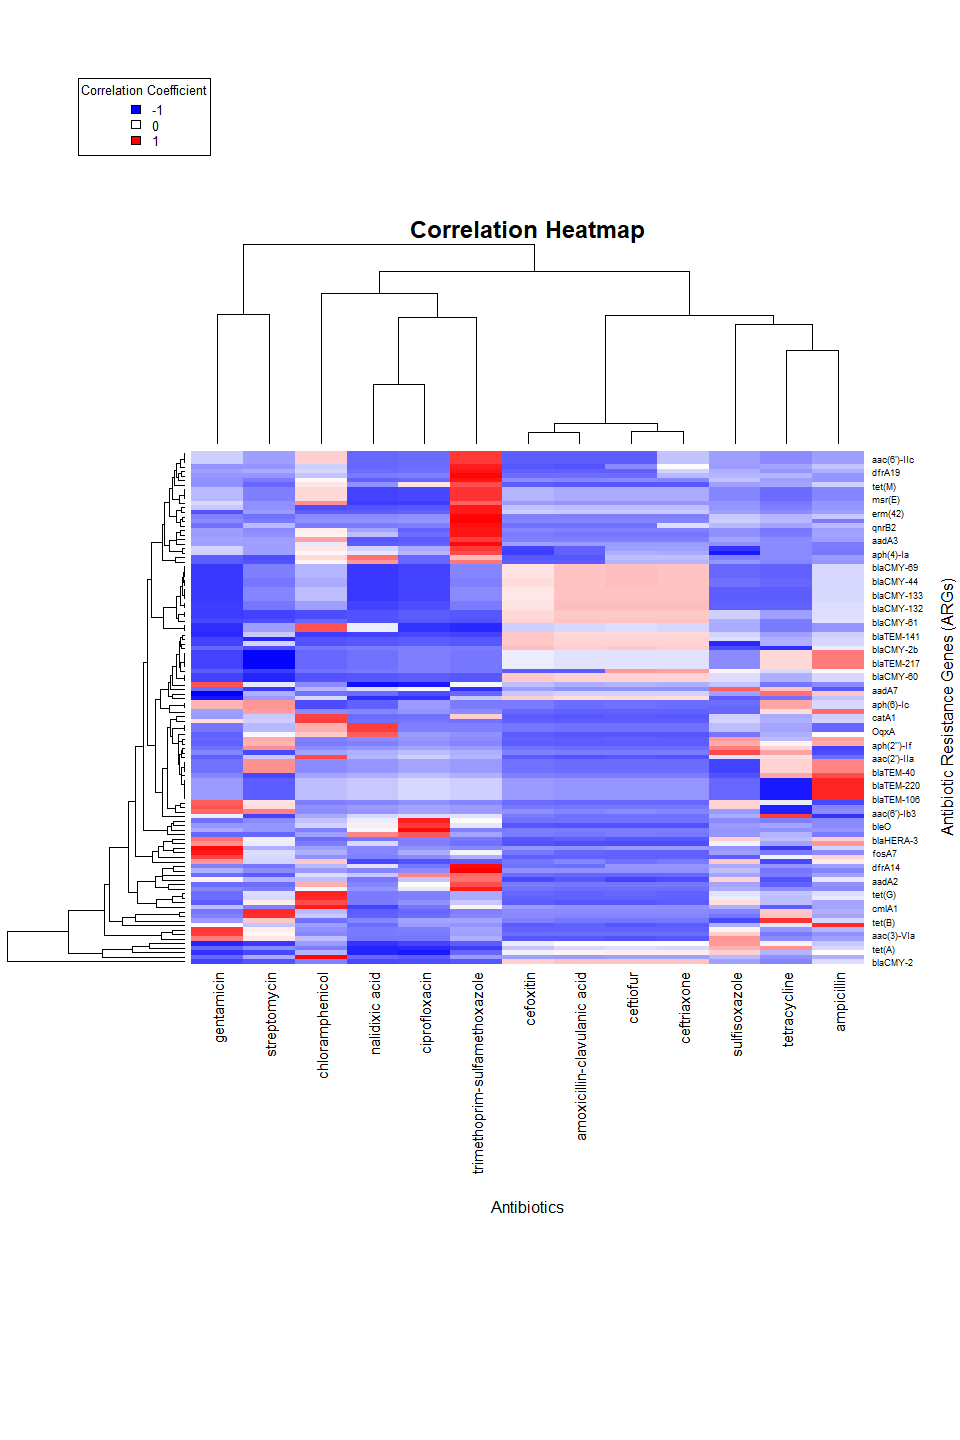
In the next section we will perform a correlation analysis between the different variables in the dataset and the multiple antibiotics.
# Prepate data for correlation analysis: Remove null values and sort data in same order
arranged_amr_labels <- amr_labels %>%
    drop_na() %>%
    arrange(SampleID)
arranged_args_data <- args_data %>%
    filter(sample_name %in% arranged_amr_labels$`SampleID`) %>%
    arrange(sample_name) %>%
    select(-sample_name) %>%
    select_if(function(x) any(x != 0))
arranged_amr_labels <- arranged_amr_labels %>%
    select(-`SampleID`)

# Calculate correlation matrix and its p-values
args_correlation_matrix_coefficients <- matrix(NA, nrow = ncol(arranged_args_data), ncol = ncol(arranged_amr_labels), dimnames = list(colnames(arranged_args_data), colnames(arranged_amr_labels)))
args_correlation_matrix_pvalues <- matrix(NA, nrow = ncol(arranged_args_data), ncol = ncol(arranged_amr_labels), dimnames = list(colnames(arranged_args_data), colnames(arranged_amr_labels)))
for (i in 1:ncol(arranged_args_data)) {
    for (j in 1:ncol(arranged_amr_labels)) {
        args_correlation_matrix_coefficients[i, j] <- cor.test(arranged_args_data[[i]], arranged_amr_labels[[j]])$estimate
        args_correlation_matrix_pvalues[i, j] <- cor.test(arranged_args_data[[i]], arranged_amr_labels[[j]])$p.value
    }
}

# TODO: analyze p-values to see if they are significant
# args_correlation_matrix <- cor(arranged_args_data, arranged_amr_labels) # Alternative method to calculate correlation matrix with coefficients but not p-values
# heatmap of correlation matrix
heatmap(args_correlation_matrix_coefficients,
    xlab = "Antibiotics", ylab = "Antibiotic Resistance Genes (ARGs)",
    main = "Correlation Heatmap",
    col = colorRampPalette(c("blue", "white", "red"))(100),
    key = TRUE,
    key.title = "Correlation Coefficients",
    # Separate axis a bit more
    margins = c(16, 6)
)
## Warning in plot.window(...): "key" is not a graphical parameter

## Warning in plot.window(...): "key.title" is not a graphical parameter

## Warning in plot.xy(xy, type, ...): "key" is not a graphical parameter

## Warning in plot.xy(xy, type, ...): "key.title" is not a graphical parameter

## Warning in title(...): "key" is not a graphical parameter

## Warning in title(...): "key.title" is not a graphical parameter
# Add gradient color legend
legend("topleft",
    legend = c("-1", "0", "1"),
    fill = colorRampPalette(c("blue", "white", "red"))(3),
    title = "Correlation Coefficient",
    cex = 0.8
)
